When I used to think about energy use, what came to mind was using energy directly in the forms of electricity, natural gas and oil (petrol). To reduce my energy consumption, I employed simple techniques such as turning down the heater, driving less and taking shorter showers. However, I knew that there was more to the equation than this, so I investigated further, and I came across the term ‘embodied energy’. Embodied energy is essentially the energy used to make something, which is captured into that item. Whether it be your couch, car, house, handbag, clothes or even the food you eat, it all takes energy to create.
I wanted to understand how much embodied energy is contained in everyday items to enable me to make better purchasing decisions to reduce my energy use. This led to me frequently questioning what type of materials I should be buying, purely from an energy perspective. For example, is it better to buy spices in glass jars or plastic refill bags? Should I buy drinks in a can or glass bottle? Which type of fabric should I choose for my clothes? And so on.
To find the answers, I searched the literature to understand the embodied energy content in the things I often use. I won’t bore you with the full details, but I will share some highlights to help you answer your own energy dilemmas. And for fellow science lovers, I have included graphs showing the energy per gram of materials to make common packaging and textiles, and associated references for your perusal.
It is important to note, this article doesn’t discuss the merits of avoiding plastic items. It is purely examining the energy required to create our everyday items. Plastic is an entirely separate topic!
Findings
I was astounded at the sheer amount of energy that goes into making every single item we consume. Whether it be from the production of raw materials, manufacturing materials into goods, or the transportation required for the item to reach your home, the energy inputs are large. Let’s take the embodied energy of a cotton t-shirt as an example. I’ve illustrated the sources of hidden energy embodied into your t-shirt in the below diagram.

As you can see from this simple example, the journey to make the t-shirt you are wearing is energy intensive. The stages all contribute to the embodied energy content of your t-shirt. The journey is a little more complex than I have shown, but this illustrates the key concepts.
If we take a moment to reflect on the sources of energy for your t-shirt, it is possible to draw some simple conclusions. If we use less packaging and reduce the distance of transportation, less energy will be consumed. For example, if we choose a t-shirt that is not wrapped in plastic, and we bring our own reusable bag to take it home, this will save on the energy required to create new packaging. Likewise, if we buy a t-shirt that has been manufactured closer to home using locally grown fibres, this will reduce the energy from transportation compared to buying a product from overseas. These are some actions we as consumers can take, to reduce our energy consumption and make our own ‘Local Impact’.
Embodied Energy in Packaging
Next, I examined how much energy it takes to make packaging for our goods. After searching high and low, it proved difficult to determine this with any certainty. What I did find is the next best thing; the embodied energy in the raw materials to make common packaging items.
I have shown the embodied energy content of common packaging materials in the chart below (Figure 1), from lowest embodied energy content to highest. It shows the number of Kilojoules (a measure of energy) per gram (weight of the raw material) in common materials that we rely on for packaging. This accounts for the embodied energy of the raw material. It is not accounting for the production of the final item. For example, the 224 Kilojoules per gram figure for aluminium, is for the pure aluminium, not for the finished drink can. There is more embodied energy in the drink can from the manufacturing and transportation processes required to produce the can.
Figure 1. Embodied energy content in packaging

If numbers are not your thing, don’t worry, I will explain!
What this graph shows us, is that in its raw form, paper is the packaging material with the lowest embodied energy content, and aluminium has the highest embodied energy content. What it doesn’t show us is how energy intensive the manufacturing of final packaging materials is. It also doesn’t factor in the weight of the packaging. Raw glass and steel have lower embodied energy than plastics, however they are also heavier, increasing the embodied energy in the final product packaging. Lets compare a glass jar and a steel can, to assess the final embodied energy content:
What do we know from this data?
- Glass has a lower embodied energy content than steel in its raw form.
What don’t we know from this data?
- Is it more energy intensive to manufacture a glass jar than a steel can using the raw materials?
What other factors are important?
- Is the glass jar heavier than the steel can?
- Did the glass jar travel further than the steel can to the point of manufacturing?
It is difficult to determine whether the glass jar or steel can contains more embodied energy! The total will depend on the energy intensity required to shape glass into a bottle, versus the steel into a can. It will depend on how much (weight) raw material is used, and also depends on other inputs such utilities to run factories and machinery used in the manufacturing processes.
To put this into context, Table 1 below shows a comparison of the energy (in Kilojoules) you would absorb into your body from eating three different food items, compared to the energy needed to produce the associated raw packaging material. This is useful to highlight just how much energy is contained in packaging. As mentioned already, the energy listed for the packaging is accounting for the raw material only, not the finished tin, jar or tub.
You can see that the glass passata jar already embodies six times more energy than the food it stores, even before the additional energy costs from manufacturing and transportation are accounted for.
Table 1. Comparison of Kilojoule content in food vs packaging

Although this exercise cannot quickly and accurately determine the total embodied energy content of packaging items, it does provide us with an awareness of the energy inputs required to produce packaging materials. Understanding the concept of embodied energy is a useful tool to understand the ‘hidden’ energy costs associated with the things we use every day. It is eye opening to realise just how much energy is embodied inside the objects we own!
At the end of the day, it is best to buy things with the least amount of packaging to reduce your energy consumption. I do this by buying food at the farmers market, taking my own reusable bags and buying food in bulk.
Embodied energy in textiles
Finally, I investigated the embodied energy content in textiles to attempt to find the least energy intensive fabric to purchase. Figure 2 below shows the number of Kilojoules per gram in raw materials used to make textiles. Once again, this doesn’t show the amount of embodied energy in the final product i.e. a cotton t-shirt. There will of course be more energy consumption in the manufacturing and transportation process to produce the t-shirt. And more again for the t-shirt to reach your home as we discovered above!
Figure 2. Embodied energy content in textiles
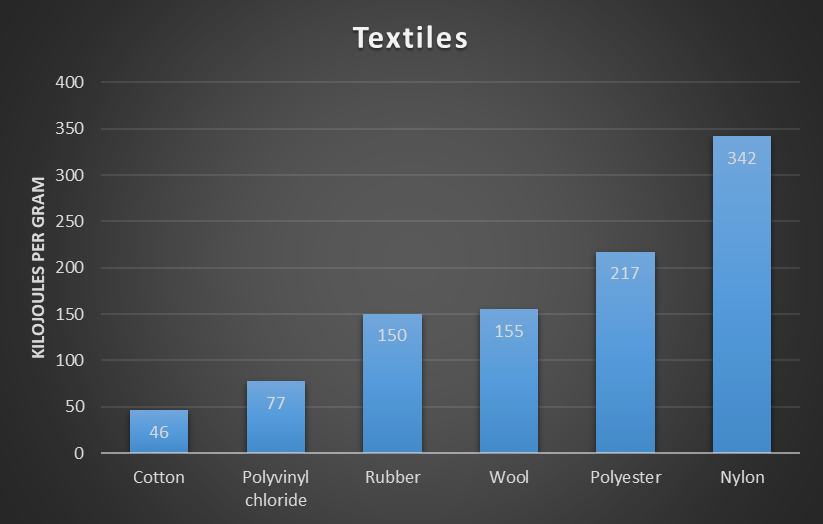
You can see from the graph that cotton has the lowest embodied energy and nylon the highest. This information gives us some clues about the type of textiles that use the lowest energy to produce the raw materials. Once again, we can’t draw conclusions about the total embodied energy content in the final products.
Having an awareness of the embodied energy in textiles provides an insight into the energy intensive nature of the textiles industry. Aside from energy, there are also other factors to consider when purchasing textiles, such as the water used to grow cotton, land clearing associated with sheep farming and rubber production, and the waste generated from plastics.
Ideally buying clothing second-hand is your best bet to minimise your impact on the environment. I started buying predominantly second-hand clothing a few years back and am amazed at the quality of items that can be found.
In conclusion, making sustainable purchases is a complex process. It is hard to know exactly how much energy is in the items we purchase. The most important thing is to be aware that energy is hidden in everything we buy. The bottom line is that all material items come at a cost to the environment. They use resources and energy to manufacture, even if done in a more sustainable manner. We can’t avoid using energy, but empowering yourself with information such as embodied energy content gives you an extra piece of the puzzle to help you make more informed purchasing decisions. Ultimately, reducing your reliance on material items, buying items without packaging and buying second hand will help you to make your own ‘Local Impact’ on the environment.
If you have any comments, leave me a note in the box below. Stay tuned for my next article on reducing plastic in your bathroom!
Appendices
Plastic Definitions
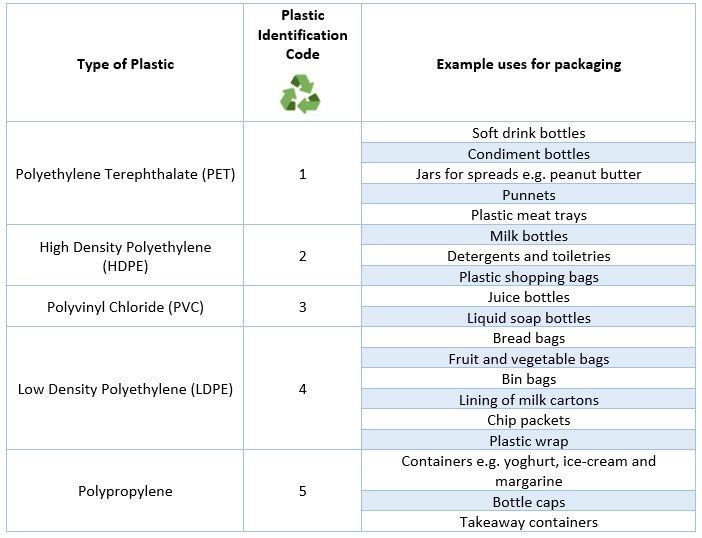
Table 2 below details the different types of plastics listed in Figure 1. I have included the plastic identification code (the number inside the triangle symbol) so you can compare items with plastic packaging you have at home. This list is not exhaustive, and items can be made from more than one type of plastic.
Table 2. Uses for plastics commonly used in food packaging.
Textile Definitions
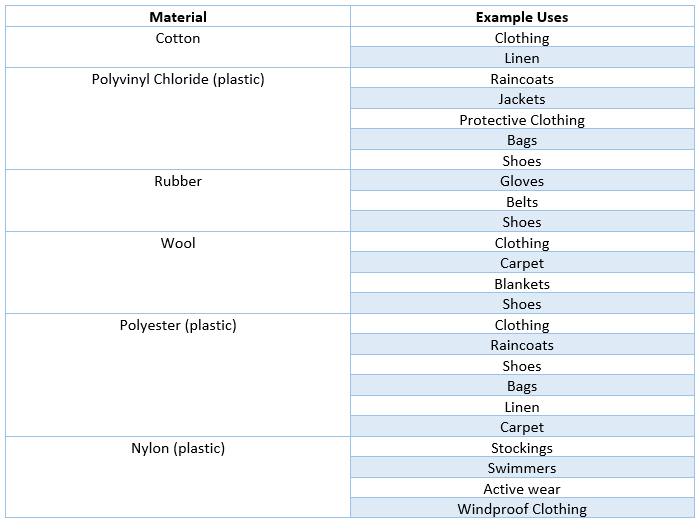
Table 3 below provides a list of uses for each of the textiles listed in figure 2. Again, it is not exhaustive, but provides a good guide.
Table 3. Uses for common textile materials
References
For those interested in further reading, I obtained the embodied energy values from the below papers:
- Camaratte, R, Volkmer, T and Osorio, A 2020, ‘Embodied energy in beverage packaging’, Journal of environmental management, vol. 260, pp. 1-4
- Keoleian, G, Blanchard, S and Reppe P 2001, ‘Life-cycle energy, costs, and strategies for improving a single-family house’, Journal of Industrial Ecology, vol. 4, no. 2, pp. 135-156
- Khabbaz, B 2010, ‘Lifecyle energy use and greenhouse gas emissions of Australian cotton: impact of farming systems’, Dissertation, University of Southern Queensland
Enter your email address below to get new content delivered directly to your inbox!

Great article Meggie. Makes you realise how complicated this all is
LikeLike
Thanks Jill! It really is so complicated. Hopefully this article helps to shed some light on just how much energy we use as a society. Cheers Megan.
LikeLike